Excel is nice…but…
A better solution comes from the open-source tool Octave. Here is the simple code to generate a sampled sine wave and perform an FFT.

Excel is nice…but…
A better solution comes from the open-source tool Octave. Here is the simple code to generate a sampled sine wave and perform an FFT.
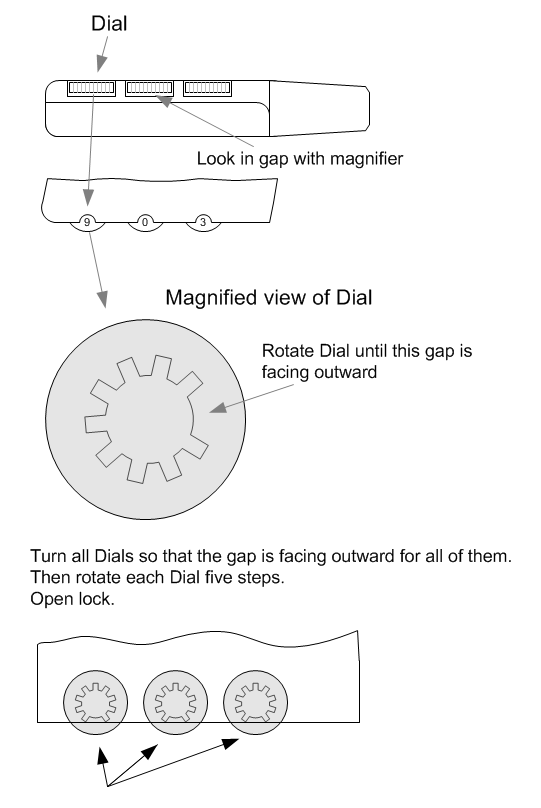
I found this lock recently. Had no idea what combination I had set, so I decided to figure out how to “unlock” the secret code! It turned out to be quite easy.

All you need is a good magnifying glass and enough light to illuminate the slot between the dials.
I needed some graphics illustrating the frequency spurs of the output of a DAC when converting a sine wave. The calculations of the spur frequencies is a function of the oversampling of the sinusoid and is trivial. But, I needed graphics. I thought about just drawing them in MSVisio but then decided that it would be fun to let Excel do the work for me.
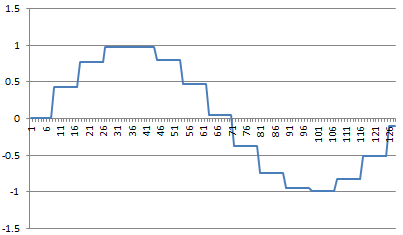
So, I wrote a Visual Basic routine in Excel that first generated a sampled-data sinusoid, then calculated the FFT of that waveform and plots both the waveform and the FFT. The parametric inputs for the calculations are the number of data points (must be power of 2), and the over sample ratio. Again pretty simple stuff.
Here is an example output of a sampled sinusoid:
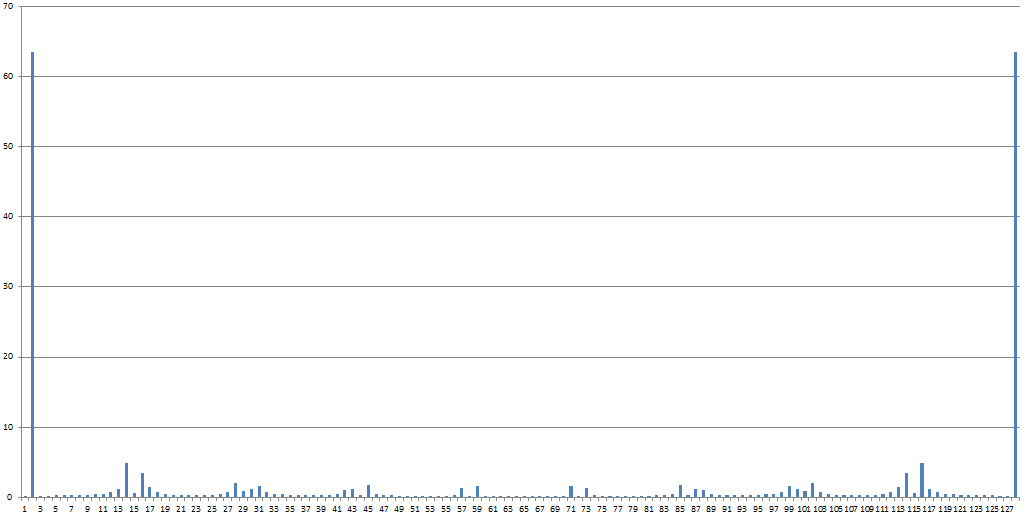
Here is the FFT output:
Here is the VB code to do this:
Sub FFTDAC()
Application.Calculation = xlCalculationAutomatic
Application.EnableEvents = True
Columns(“C:C”).Select
Selection.ClearContents
Pi = 3.1415926
Range(“H1”).Offset(0, 0).Select
samples = Selection.Offset(0, 0).Value
OSR = Selection.Offset(1, 0).Value
inc = samples / OSR
Range(“A1”).Offset(0, 0).Select
For i = 1 To samples
arg = i – i Mod inc
arg = arg * 2 * Pi / samples
Value = Sin(arg)
Selection.Offset(0, 0).Value = Value
Selection.Offset(1, 0).Select
Next i
Range(“D1”).Offset(0, 0).Select
For i = 1 To samples
cellname = “C” & i
fcn = “=ImAbs(” + cellname + “)”
Selection.Offset(0, 0).Value = fcn
Selection.Offset(1, 0).Select
Next i
Application.Run “ATPVBAEN.XLAM!Fourier”, ActiveSheet.Range(“$A$1:$A$128”), _
ActiveSheet.Range(“$C$1”), False, False
End Sub
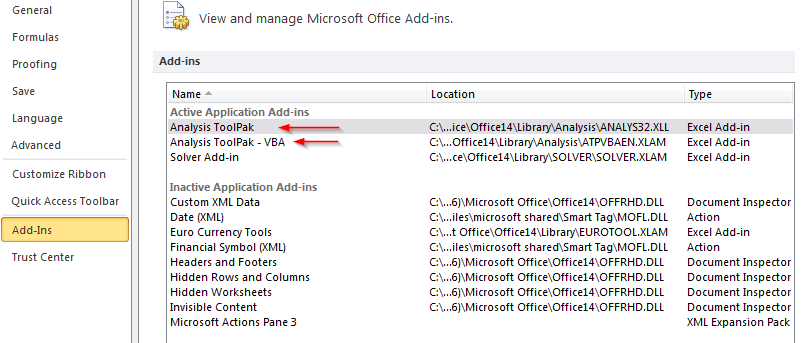
In order for this macro to work, you have to install/enable the Analysis ToolPak and Analysis ToolPak VBA